RFMA 2422
Trapline-specific descriptive results.
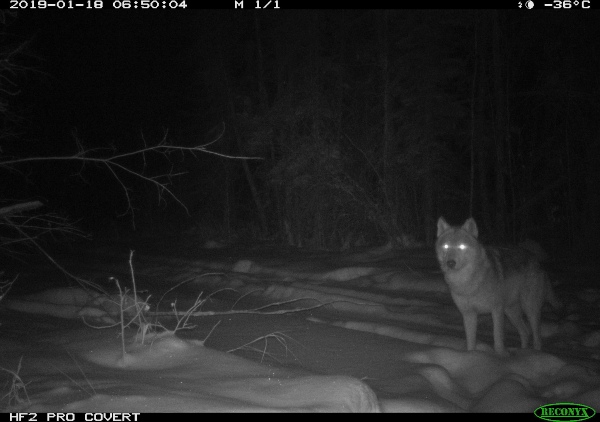
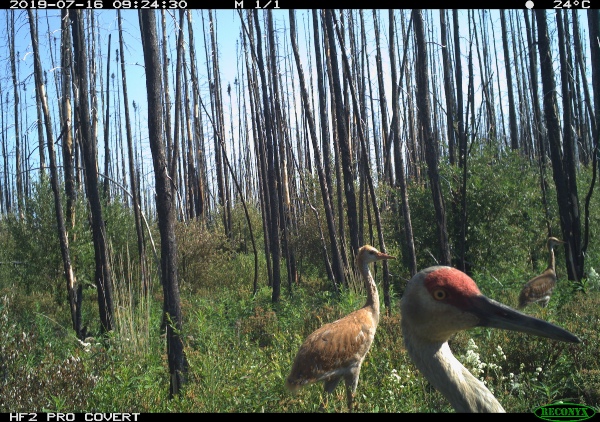
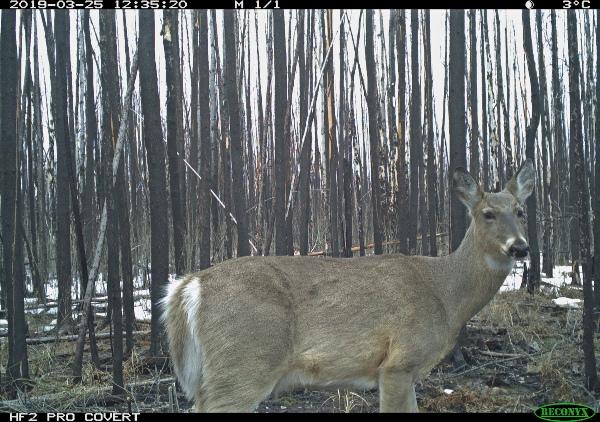
Featured Images
Context
Destiny Golosky is the trapper on Trapline 2422. Her father Richard Golosky previously held the line and Destiny was the junior. Destiny’s trapline was burned significantly during the 2016 wildlife. Forestry activity to salvage trees in the years following the wildfire created more disturbance on the trapline. Proposed in situ oil sands projects are also located within and adjacent to the trapline.
Human Footprint in 2018
Trapline 2422 had a moderate amount of human footprint relative to the three traplines in the study. Of the 5.5% human footprint covering the area of this trapline, forestry features made up the majority of the footprint cover.
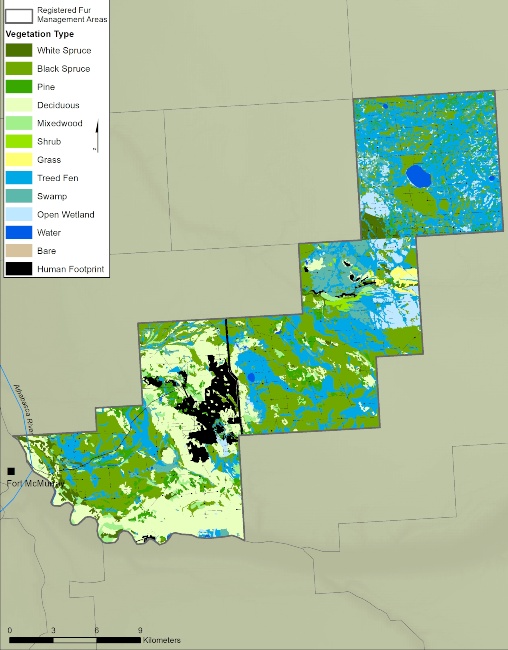
Landcover Map
Trapline 2422 is mainly made up of forested land cover, primarily:
-
Black Spruce (28.5% of the area)
-
Treed Fen (26.4%),
-
Deciduous Forest (17.6%), and
-
Pine Forest (5.5%).
Swamp features also make up a significant portion of the area (5.1%).
Landcover Descriptions
This table shows the habitats that cameras were placed in on Trapline 2422. There is considerable variation, which likely allowed a wide variety of animals to be captured. For example, Camera 2 was placed in 100% Treed Fen, whereas Camera 20 was placed in 100% forestry footprint.
| Camera | Cover (Landcover/Human Footprint) | Area (%) |
|---|---|---|
| 1 | Black Spruce | 5.7 |
| Deciduous | 94.1 | |
| Energy Footprint | 0.2 | |
| 2 | Treed Fen | 100.0 |
| 3 | Deciduous | 99.9 |
| White Spruce | 0.1 | |
| 4 | Black Spruce | 100.0 |
| 5 | Deciduous | 96.3 |
| Open Wetland | 3.7 | |
| 6 | Deciduous | 71.0 |
| Urban, Rural & Industrial Footprint | 29.0 | |
| 7 | Deciduous | 96.7 |
| Transportation Footprint | 3.3 | |
| 8 | Deciduous | 42.8 |
| Mixedwood | 16.8 | |
| Pine | 33.4 | |
| Swamp | 7.0 | |
| 10 | Deciduous | 48.3 |
| Mixedwood | 48.8 | |
| Transportation Footprint | 2.9 | |
| 11 | Black Spruce | 0.7 |
| Pine | 46.9 | |
| Treed Fen | 52.3 | |
| Water | 0.1 | |
| 12 | Deciduous | 34.8 |
| White Spruce | 65.2 | |
| 13 | Deciduous | 24.5 |
| White Spruce | 73.8 | |
| Transportation Footprint | 1.6 | |
| 14 | Deciduous | 100.0 |
| 15 | Treed Fen | 74.4 |
| Energy Footprint | 25.6 | |
| 16 | Treed Fen | 94.9 |
| Transportation Footprint | 5.1 | |
| 17 | Pine | 79.4 |
| Transportation Footprint | 20.6 | |
| 18 | Pine | 5.3 |
| Treed Fen | 94.7 | |
| 19 | Black Spruce | 3.1 |
| Deciduous | 90.9 | |
| Energy Footprint | 4.9 | |
| Forestry Footprint | 1.1 | |
| 20 | Forestry Footprint | 100.0 |
| 21 | Black Spruce | 17.4 |
| Deciduous | 20.7 | |
| Pine | 61.6 | |
| Transportation Footprint | 0.3 | |
| 22 | Forestry Footprint | 100.0 |
| 23 | Black Spruce | 2.1 |
| Deciduous | 89.5 | |
| Energy Footprint | 8.4 | |
| 24 | Black Spruce | 58.7 |
| Transportation Footprint | 41.3 | |
| 25 | Black Spruce | 81.0 |
| Deciduous | 10.2 | |
| Treed Fen | 1.6 | |
| Energy Footprint | 7.3 | |
| 26 | Black Spruce | 80.1 |
| Deciduous | 12.4 | |
| Treed Fen | 0.4 | |
| Energy Footprint | 7.2 | |
| 27 | Deciduous | 92.4 |
| Energy Footprint | 7.6 | |
| 28 | Black Spruce | 56.7 |
| Deciduous | 38.3 | |
| Transportation Footprint | 5.0 | |
| 29 | Black Spruce | 78.8 |
| White Spruce | 13.0 | |
| Energy Footprint | 7.6 | |
| Transportation Footprint | 0.6 |
Number of Images
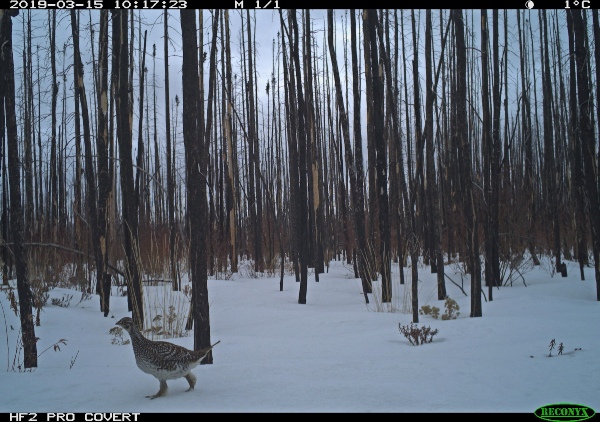
Trapline 2422 captured 9,581 images from 25 cameras, and these images were made up of 11 species.
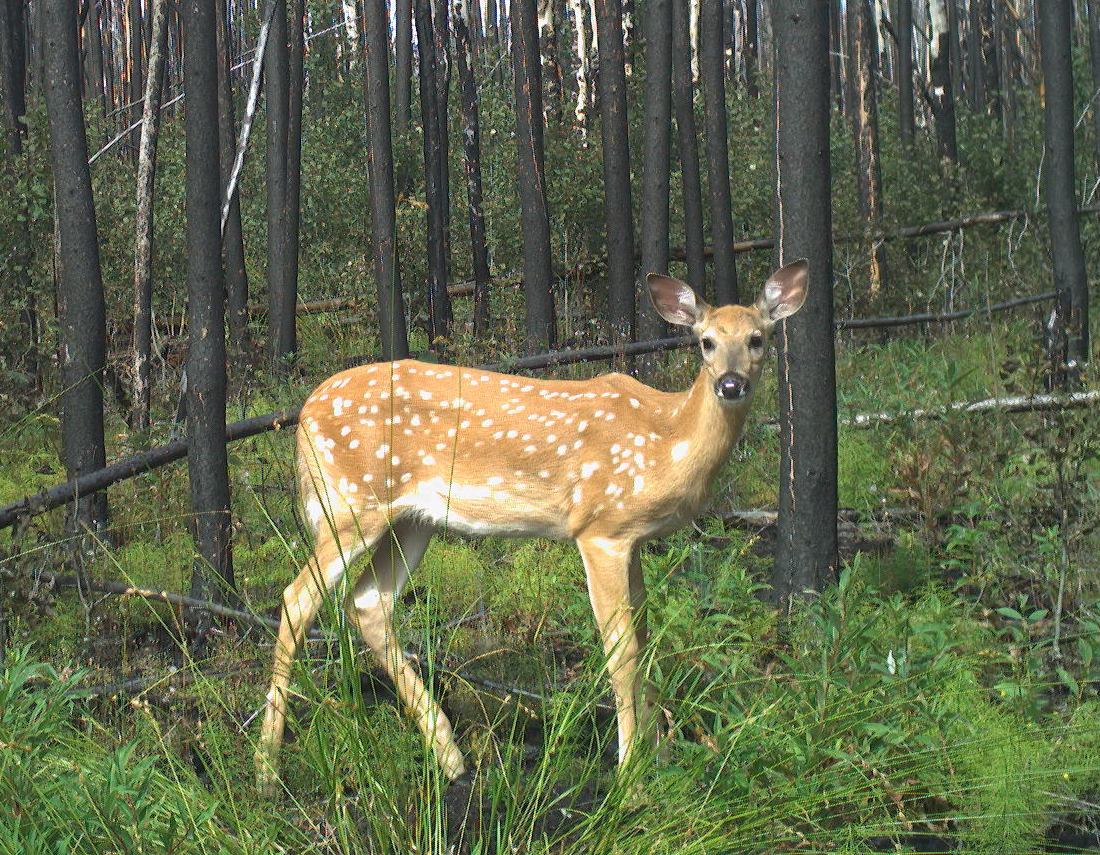
- White-tailed deer were the most common species captured on this trapline, with 7,125 images, the most of the three traplines by a large margin; the next most deer-heavy trapline had 3,933 images, while the third had only 22.
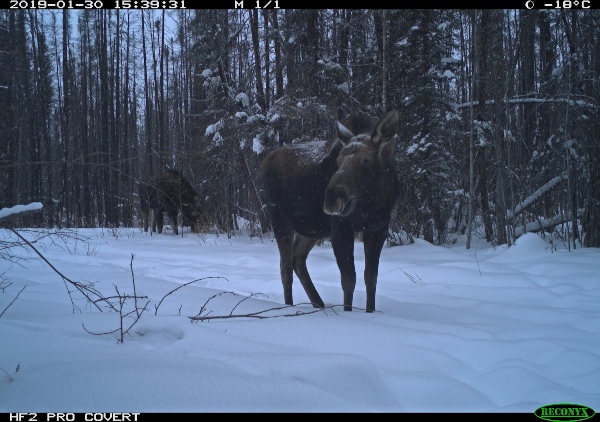
- Moose and Black Bears were the next most numerous animals tagged in this trapline.
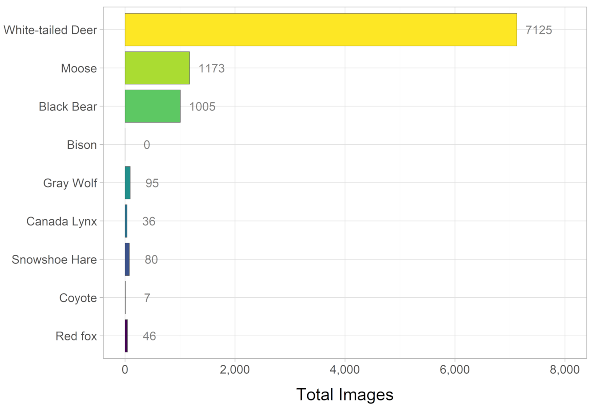
| Species | Number of Images |
|---|---|
| Black Bear | 1005 |
| Canada Lynx | 36 |
| Coyote | 7 |
| Fisher | 1 |
| Gray Wolf | 95 |
| Marten | 7 |
| Moose | 1173 |
| Red Fox | 46 |
| Snowshoe Hare | 80 |
| Weasels and Ermine | 6 |
| White-tailed Deer | 7125 |
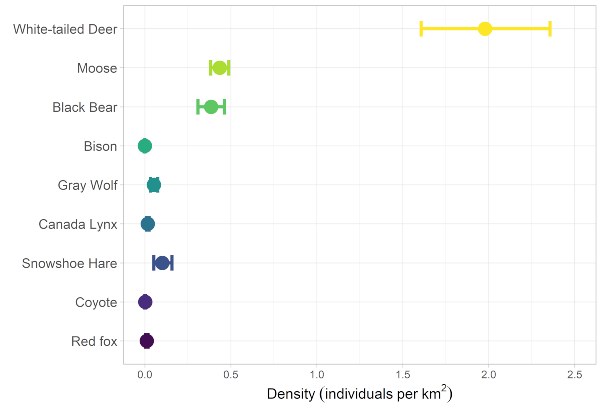
Estimated Density
We can use the camera images to estimate the abundance of animals in a trapline, referred to as density. This is done by using the length of time the camera is in the field, the total time over which each species is present in the camera field of view, and the size of area that each camera is capturing. More details about estimated density of each species over the whole project and by trapline can be found in Section 3.1.
The density estimates on this trapline have relatively tight error bars, allowing us to make some inferences. For example, we can see that White-tailed Deer were more abundant than any other species, at about 2 individuals per km2, with Moose and Black Bears being the next most abundant at about 0.5 individuals per km2.
The spatial analysis results in this project showed us that White-tailed Deer were more common in disturbed areas, so the 5.5% human footprint and 43.6% percent burned areas in this trapline may have contributed to the larger number of deer.
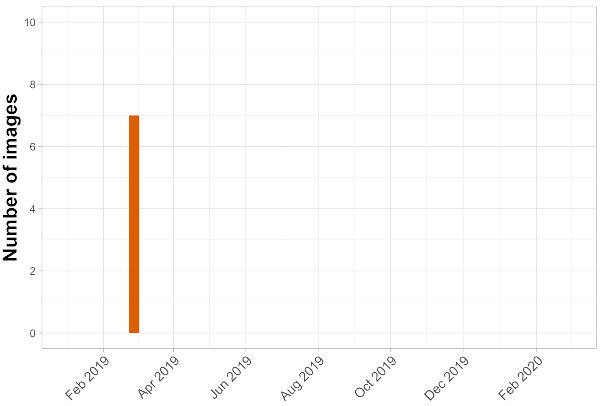
Human Activity
Images with both “Human” and “Vehicle” tags were added to show human activity in this trapline. This trapline had the lowest captured human activity throughout this project of the three traplines used, with 7 images of humans or vehicles in spring 2019.