.jpg)
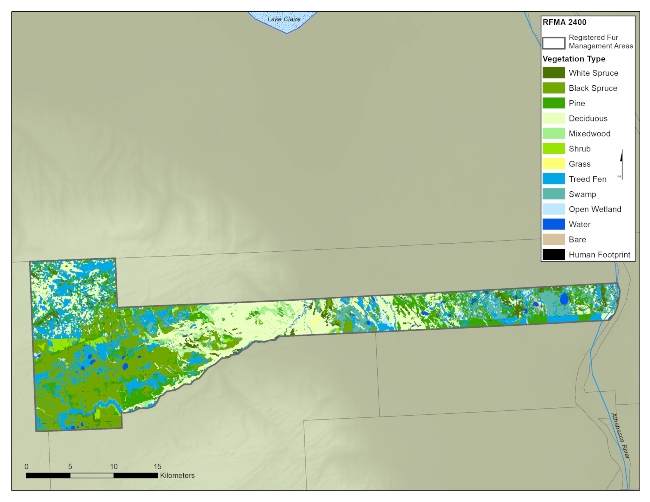
RFMA 2400
Trapline-specific descriptive results.
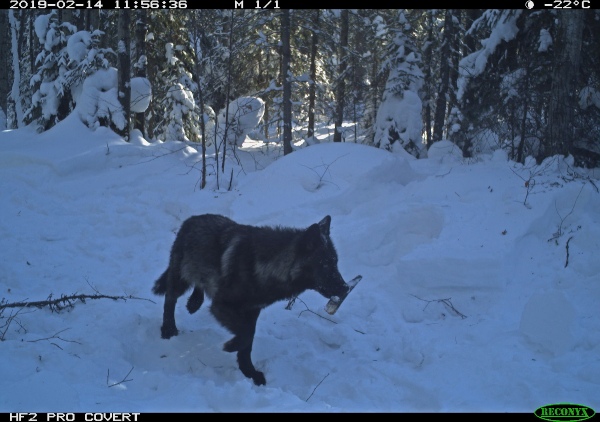
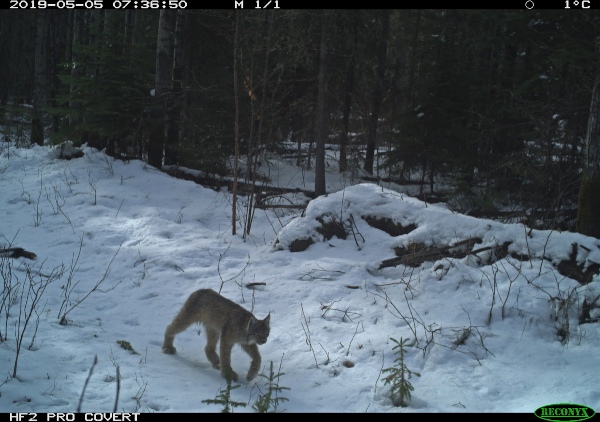
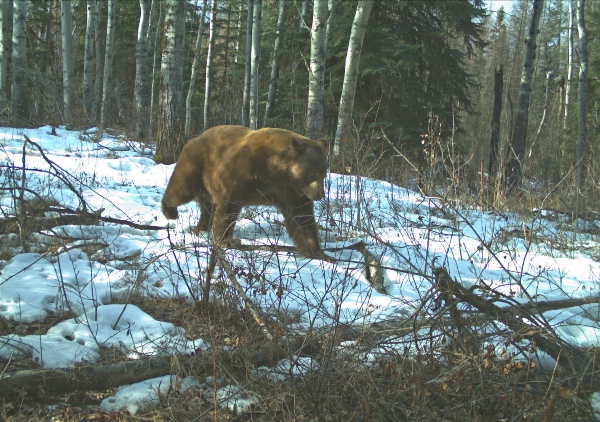
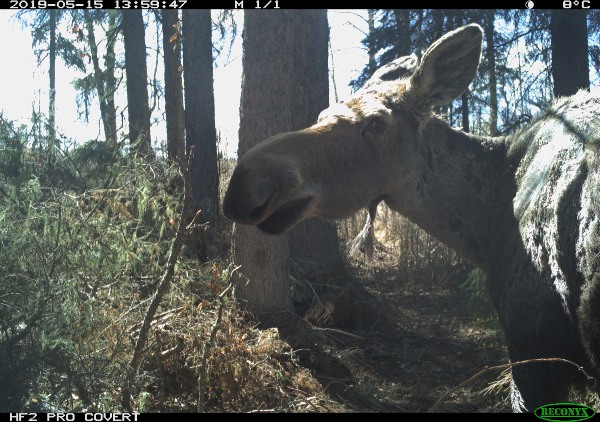
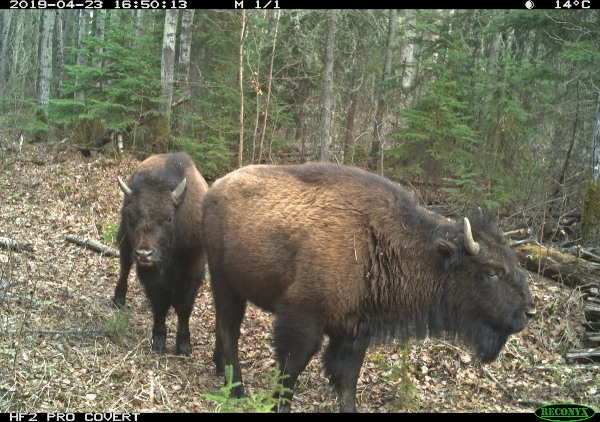
Featured Images
Context
Frank La Caille bought RFMA 2400 in 1974 and currently resides on the trapline.
Human Footprint in 2018
Trapline 2400 had the least amount of human footprint of the three traplines in the study. Of the 0.2% human footprint covering the area of this trapline, energy features–specifically conventional seismic features–made up the majority of the footprint cover.
Landcover
Trapline 2400 is mainly made up of forested landcover, primarily:
-
Black Spruce (24% of the area)
-
Deciduous Forest (22.9%)
-
Treed Fen (18.8%), and
-
Pine Forest (14.7%).
Swamp features also make up a significant portion of the area (7.2%).
Landcover Descriptions
This table shows the habitats that cameras were placed in on Trapline 2400. There is considerable variation, which likely allowed a wide variety of animals to be captured. For example, Camera 99 was placed in 100% swamp, whereas Camera 116 was placed in 100% Pine Forest.
| Camera | Cover (Landcover/Human Footprint) | Area (%) |
| 93 | Water | 100.0 |
| 94 | Open Wetland | 78.4 |
| Treed Fen | 21.6 | |
| 95 | Deciduous | 84.8 |
| Water | 9.3 | |
| Energy Footprint | 5.9 | |
| 95-1 | Deciduous | 47.7 |
| White Spruce | 46.3 | |
| Energy Footprint | 6.0 | |
| 99 | Swamp | 100.0 |
| 107 | Swamp | 49.3 |
| Water | 50.7 | |
| 109 | Deciduous | 31.8 |
| Swamp | 67.4 | |
| Water | 0.8 | |
| 113 | Pine | 99.5 |
| Energy Footprint | 0.5 | |
| 114 | Black Spruce | 96.2 |
| Energy Footprint | 3.8 | |
| 115 | Treed Fen | 96.2 |
| Energy Footprint | 3.8 | |
| 116 | Pine | 100.0 |
| 117 | Swamp | 96.2 |
| Energy Footprint | 3.8 | |
| 119 | Deciduous | 37.9 |
| Treed Fen | 59.0 | |
| Water | 3.1 | |
| 20 | Deciduous | 27.5 |
| Swamp | 72.5 |
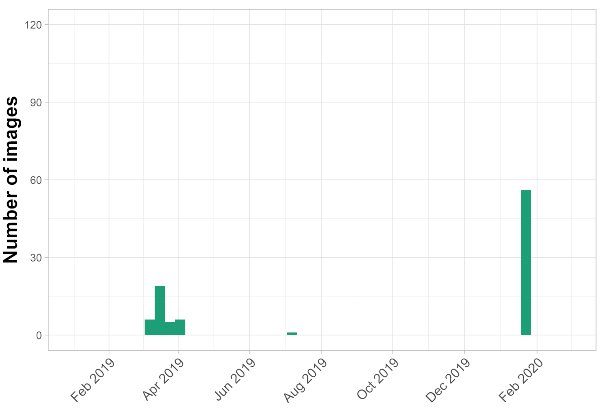
Number of Images
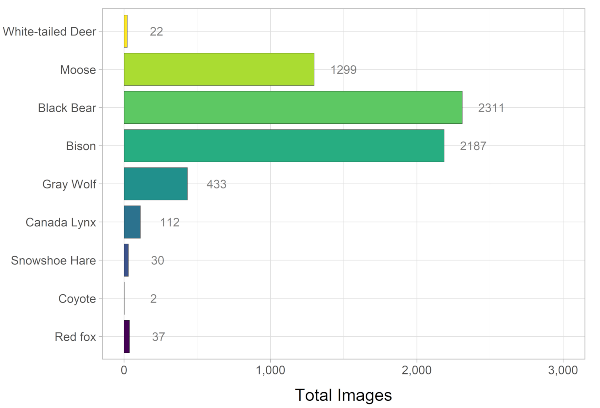
Trapline 2400 captured 6,512 images from 14 cameras, and these images were made up of 15 species.
- This was the only trapline of the three in this project that captured Bison, which was the second most captured species on this trapline.
- Black Bears and Moose were the first and third most numerous animals tagged in the images on this trapline.
| Species | Number of Images |
|---|---|
| Bison | 2187 |
| Black Bear | 2311 |
| Canada Lynx | 112 |
| Coyote | 2 |
| Fisher | 18 |
| Gray Wolf | 433 |
| Hoary Marmot | 7 |
| Moose | 1299 |
| Raccoon | 2 |
| Red Fox | 37 |
| Red Squirrel | 47 |
| Snowshoe Hare | 30 |
| Striped Skunk | 4 |
| White-tailed Deer | 22 |
| Wolverine | 1 |
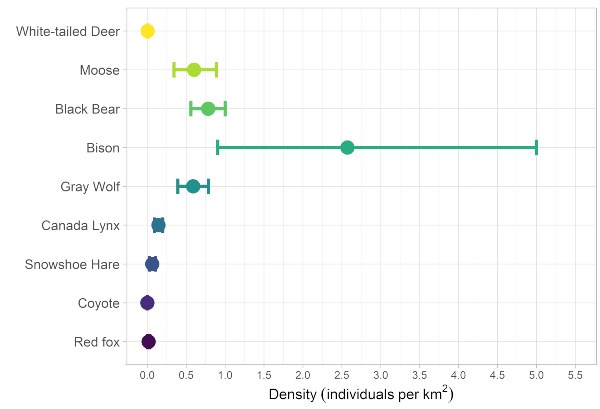
Estimated Density
We can use the camera images to estimate the abundance of animals in a trapline, referred to as density. This is done by using the length of time the camera is in the field, the total time over which each species is present in the camera field of view, and the size of area that each camera is capturing. More details about estimated density of each species over the whole project and by trapline can be found in Section 3.1.
Bison had the highest estimated density of any animal captured on this trapline, at 2.6 individuals per km2, but with error bars ranging from 1 to 5. The error bars are wide because only 5 of the 15 cameras detected a bison, and one camera in particular (FL-WP95-MM33) detected a large number (over 31 individuals per km2). This skewed distribution is typical of herding animals; elk is another example that shows this pattern.
Moose, black bears, and gray wolves had the next highest density, at about 1 individual per km2.
Human Activity
Images with both “Human” and “Vehicle” tags were added to show human activity in this trapline. Because of the clumped pattern, it’s likely that this is mainly reflecting set up and take down of cameras.