RFMA 2234
Trapline-specific descriptive results.
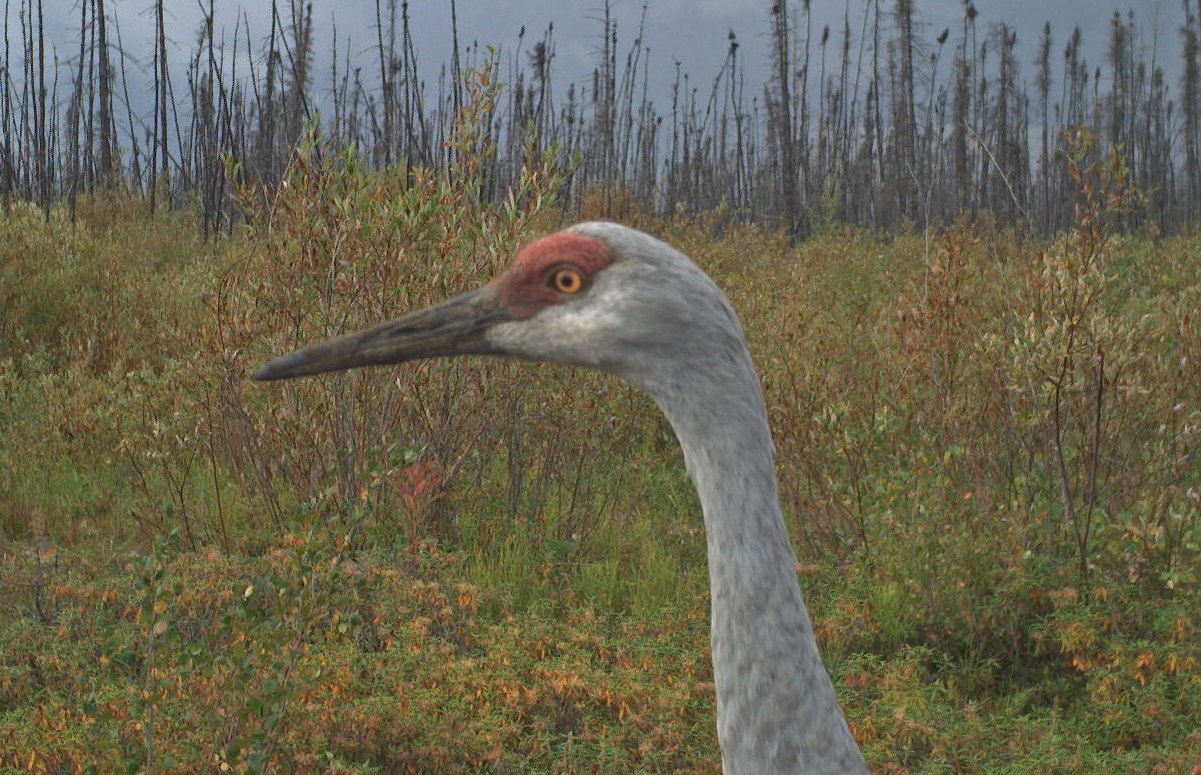
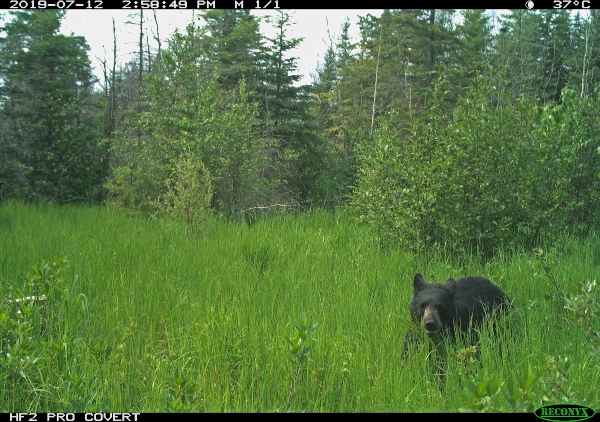
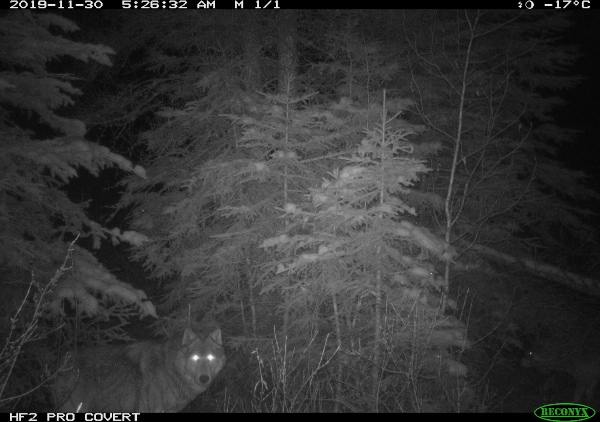
Featured Images
Context
Lloyd Grant is the trapper on Trapline 2234. Lloyd is concerned about increased traffic, vandalism and trespassing on his trapline as it is close to the highway and Fort McMurray.
Human Footprint in 2018
Trapline 2234 had the highest amount of human footprint of the three traplines in the study. Of the 10.4% human footprint covering the area of this trapline, urban, rural, and industrial features, as well as transportation features made up the majority of the footprint cover. This trapline was the closest of the three used in this study to a major city: Fort McMurray.
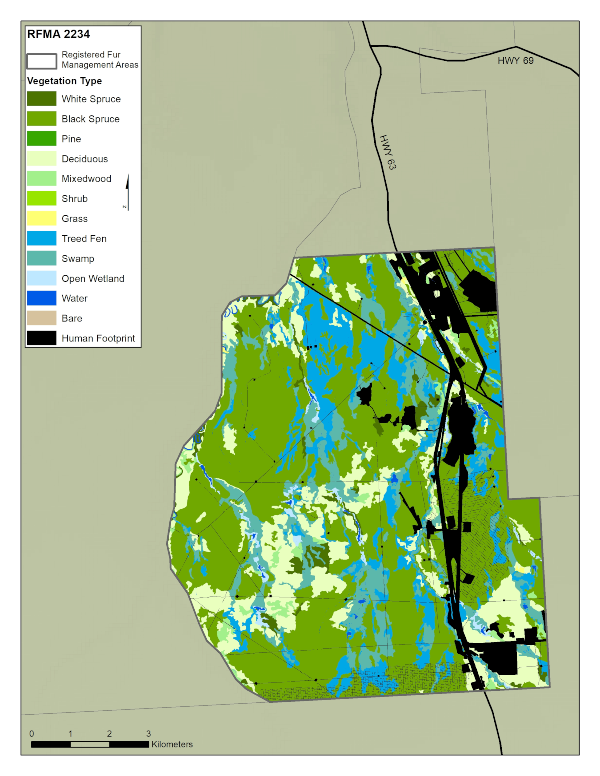
Landcover Map
Trapline 2234 is mainly made up of forested land cover, primarily:
-
Black Spruce (48.6% of the area)
-
Deciduous Forest (13.6%), and
-
Treed Fen (11.2%),
Swamp features also make up a significant portion of the area (11%).
Landcover Descriptions
This table shows the habitats that cameras were placed in on Trapline 2234. There is considerable variation, which has the potential to allow a wide variety of animals to be captured. For example, Camera 2 was placed in 100% Black Spruce, Camera 5 was placed in 92% Swamp, and Camera 18 was placed in 66% transportation footprint.
| Camera | Cover (Landcover/Human Footprint) | Area (%) |
| 1 | Black Spruce | 78.4 |
| Energy Footprint | 21.6 | |
| 2 | Black Spruce | 100.0 |
| 3 | Black Spruce | 24.4 |
| Deciduous | 70.5 | |
| Transportation Footprint | 5.0 | |
| 4 | Treed Fen | 92.4 |
| Energy Footprint | 7.6 | |
| 5 | Swamp | 92.2 |
| Water | 1.3 | |
| Energy Footprint | 6.5 | |
| 6 | Black Spruce | 67.3 |
| Energy Footprint | 32.7 | |
| 7 | Black Spruce | 71.0 |
| Swamp | 7.1 | |
| Energy Footprint | 20.3 | |
| Transportation Footprint | 1.6 | |
| 8 | Black Spruce | 94.2 |
| Energy Footprint | 5.8 | |
| 9 | Deciduous | 12.6 |
| Water | 27.0 | |
| White Spruce | 58.1 | |
| Transportation Footprint | 2.4 | |
| 10 | Black Spruce | 89.6 |
| Energy Footprint | 7.6 | |
| Transportation Footprint | 2.8 | |
| 11 | Deciduous | 41.0 |
| Swamp | 51.4 | |
| Energy Footprint | 7.6 | |
| 12 | Deciduous | 44.4 |
| Swamp | 54.8 | |
| Water | 0.8 | |
| 13 | Deciduous | 4.3 |
| Mixedwood | 95.7 | |
| 14 | Black Spruce | 11.0 |
| Deciduous | 83.9 | |
| Transportation Footprint | 5.1 | |
| 15 | Black Spruce | 9.4 |
| Swamp | 64.4 | |
| Energy Footprint | 26.2 | |
| 16 | Black Spruce | 1.9 |
| Deciduous | 63.5 | |
| Grass | 22.9 | |
| Swamp | 0.5 | |
| Treed Fen | 1.5 | |
| Urban, Rural & Industrial Footprint | 9.7 | |
| 17 | Black Spruce | 24.3 |
| Deciduous | 34.8 | |
| Swamp | 3.3 | |
| Treed Fen | 27.2 | |
| Water | 0.8 | |
| Transportation Footprint | 9.6 | |
| 18 | Deciduous | 12.3 |
| Swamp | 17.8 | |
| Water | 2.6 | |
| Energy Footprint | 1.5 | |
| Transportation Footprint | 65.8 | |
| 19 | Deciduous | 14.5 |
| Grass | 28.9 | |
| Swamp | 26.7 | |
| Transportation Footprint | 3.0 | |
| Urban, Rural & Industrial Footprint | 26.8 | |
| 20 | Deciduous | 30.3 |
| Transportation Footprint | 19.5 | |
| Human-created Water Bodies Footprint | 50.3 |
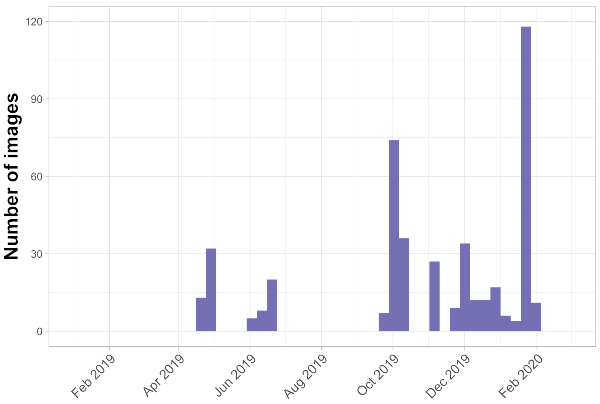
Number of Images
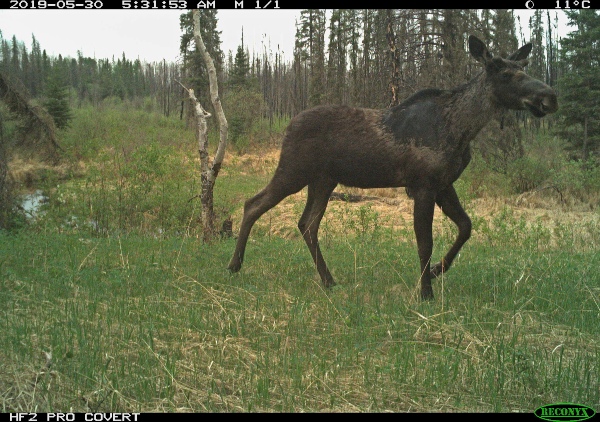
Trapline 2234 captured 6,232 images from 18 cameras, and these images were made up of 9 species.
- White-tailed deer were the most common species captured on this trapline, with 3,933 images.
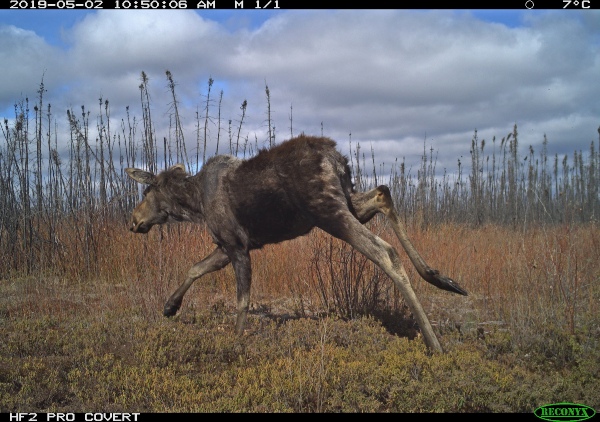
- Moose was the next most common capture with 1,560 images.
Because of the proximity to Fort McMurray, increased human activity (see below) and a relatively high amount of human footprint may have contributed to the slightly lower number of species captured on this trapline relative to the others in this project.
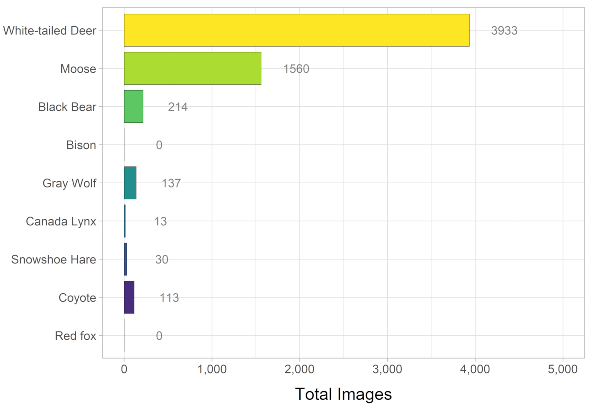
| Species | Number of Images |
|---|---|
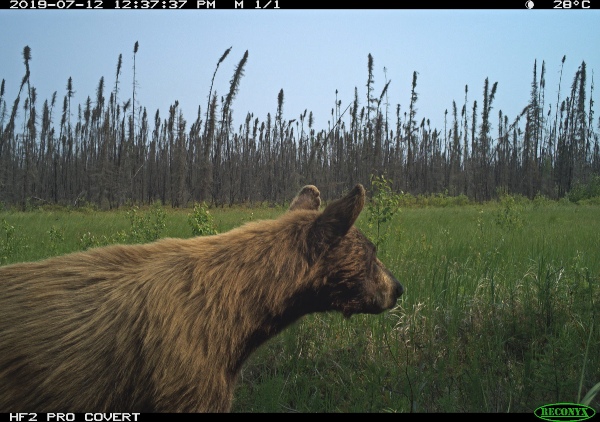
| Beaver | 230 |
| Black Bear | 214 |
| Canada Lynx | 13 |
| Coyote | 113 |
| Gray Wolf | 137 |
| Moose | 1560 |
| Snowshoe Hare | 30 |
| Voles, Mice and Allies | 2 |
| White-tailed Deer | 3933 |
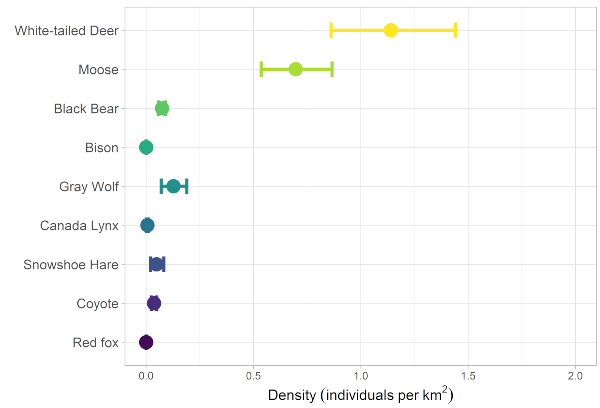
Estimated Density
We can use the camera images to estimate the abundance of animals in a trapline, referred to as density. This is done by using the length of time the camera is in the field, the total time over which each species is present in the camera field of view, and the size of area that each camera is capturing. More details about estimated density of each species over the whole project and by trapline can be found in Section 3.1.
White-tailed deer had the highest estimated density of any animal captured on this trapline, at just over 1 individual per km2, with Moose being the next most abundant at about 0.75 individuals per km2. All other species captured had estimated densities of under 0.25 individuals per km2.
Human Activity
Images with both “Human” and “Vehicle” tags were added to show human activity in this trapline. This trapline showed the most human activity of the three used in this project. Because of its proximity to Fort McMurray, it is likely part of a more accessible recreation spot than than other two lines.