Section 2.2
Human Footprint
Current and historical human footprint in the region.
Human Footprint
As of 2018, the total human footprint in Métis Harvesting Area B (12,6436 km2) was 12.1%
Land disturbance, reported as per cent human footprint, is considered to be the primary driver of biodiversity change worldwide. Understanding what kind of disturbance is happening, what type of habitats (vegetation) are being transformed, and how species that rely on those habitats are affected, is valuable information to consider when making decisions about land use.
As of 2018, the total human footprint in Métis Harvesting Area B (12,6436 km2) was 12.1%.
This was largely made up of :
- Agriculture footprint (5.0%)
- Forestry footprint (2.6%)
- Energy footprint (1.6%)
Definition of Human Footprint Categories
The ABMI defines human footprint as the visible alteration or conversion of native ecosystems to temporary or permanent residential, recreational, agricultural, or industrial landscapes. This includes land that is periodically reset to earlier successional conditions by industrial activities such as harvest areas and seismic lines.
 Agriculture
Areas of annual or perennial cultivation, including crops, tame pasture, confined feeding operations, and other high-density livestock areas.
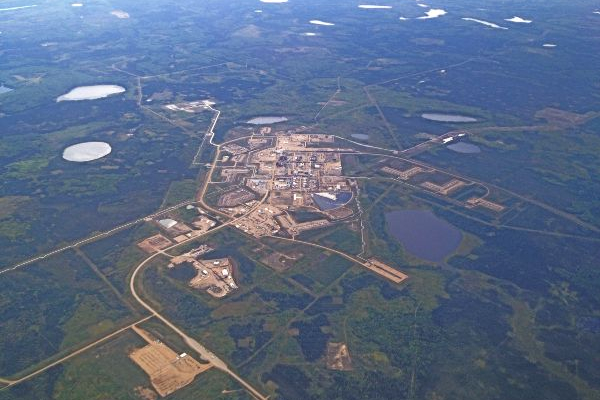
 Energy Footprint (Mines, Wells, & Other Energy Features)
Areas where vegetation or soil has been disturbed by footprint types associated with the energy sector, including mine sites, peat mines, pipelines, seismic lines, transmission lines, well sites, and wind-generation facilities.
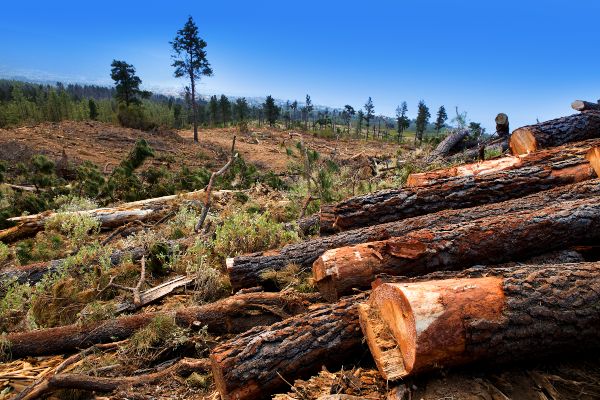
 Forestry
Areas in forested landscapes where timber resource extraction has occurred for industrial purposes, including clear-cut and partial-cut logging methods.
 Transportation Footprint
Railways, roadways, and trails with hard surfaces such as concrete, asphalt, or gravel; roads or trails without hard surfaces; and the vegetation strips alongside transportation features.
 Urban/Industrial Footprint (Urban, Rural, & Industrial Features)
Residences, buildings, and disturbed vegetation and substrate associated with urban and rural settlements, such as housing, shopping centres, industrial areas, golf courses, and recreation areas, as well as bare ground cleared for industrial and commercial development. In some areas in the OSR, such as the Mineable Region, the footprint in this category is predominantly industrial facilities associated with energy development.
 Human-created Waterbodies
Waterbodies created for a variety of purposes, such as to extract fill (borrow-pits, water treatment), water livestock (dugouts), transport water (canals), meet municipal needs (water supply and sewage), and store water (reservoirs).
Human Footprint
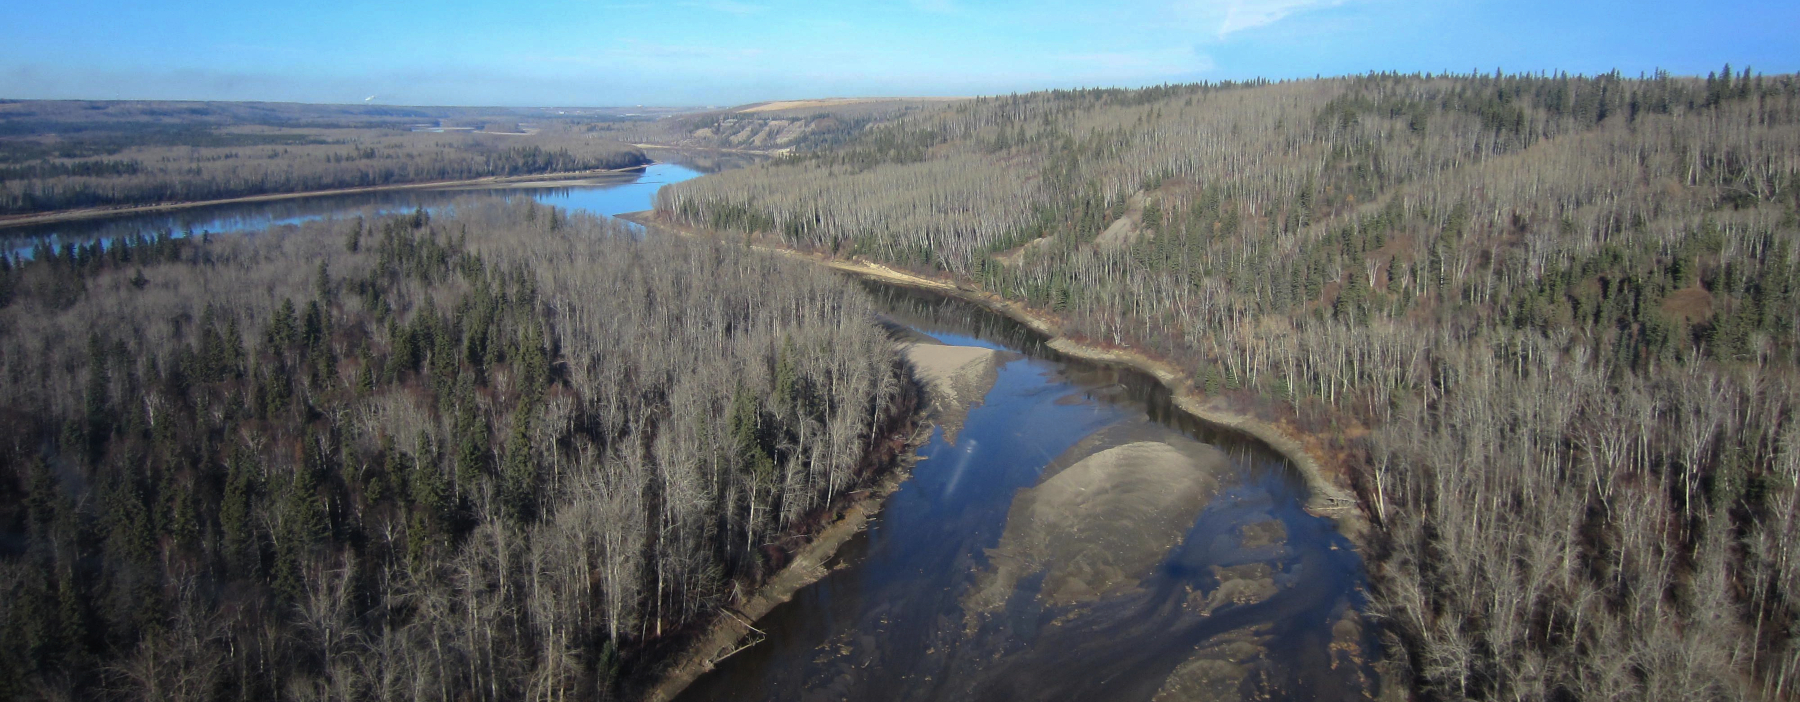
In addition to knowing the extent of human footprint in an area, understanding how that footprint is distributed throughout the region is also important. In Harvesting Area B, human footprint is distributed throughout the region, with the exception of the panhandle region of the northeast. Human footprint is greatest in the urban center and rural surroundings of Fort McMurray, as well as the extensive oil mining projects to the north, and along the shores of the Athabasca River. There are other settlements in the south of Harvesting Area B, including Lac La Biche, Athabasca, Cold Lake, and Bonnyville.
As the industry gets bigger, and more people move in, it's like I say, we can go back to 50 years ago and this town was just a small town, I mean when I grew up here, there was just twelve hundred people and now there’s one hundred twenty thousand!
Harvey Sykes
The southern reaches of the Harvesting Area close to Edmonton are predominantly shrubland or grassland, and highly developed as agricultural land dotted with towns. Agricultural development is especially intense surrounding Glendon, and on the Highway 2 corridor between Edmonton and Athabasca.
Human Footprint Changes between 2010 & 2018
All categories of human footprint have increased between 2010 and 2018 in Métis Harvesting Area B, as follows:
-
Total human footprint: increased from 10.7% (2010) to 12.1% (2018)
-
Agriculture footprint: increased from 5.03% to 5.10%
-
Forestry footprint: increased from 2.62% to 3.45%
-
Energy footprint: increased from 1.62% to 1.95%
-
Human-created Water Body footprint: increased from 0.06% to 0.08%
-
Transportation footprint: increased from 0.63% to 0.69%
-
Urban, Rural, & Industrial footprint; increased from 0.64% to 0.80%
If you look at a picture of a map, maybe 20, 30 years ago, and you see the progression of the footprint of the industry, it’s grown, there’s a spot there.
Lenny Hansen Jr.
Human Footprint Change
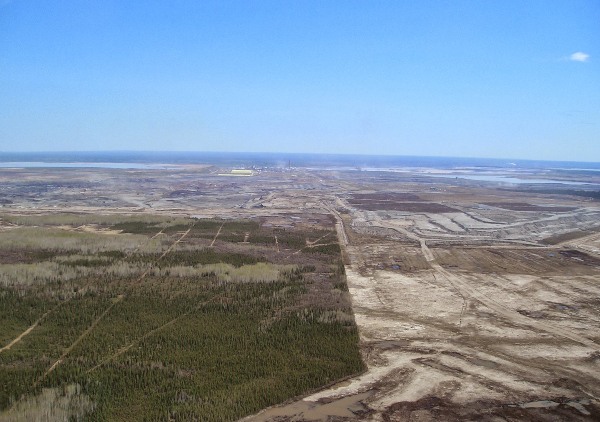
The rate of change to lands in Harvesting Area B is rapid and ongoing, with over 10% of the total land use change occurring between 2010 and 2018. The largest increases in this time are associated with oil development and forestry, with particularly major expansions of seismic lines, borrow pits, tailings ponds, oil sands mines, and forestry harvest areas. Tailings ponds, for example, occupied 0.84 km2 in 2010, and increased to 14.6 km2 in 2018, a 17-fold increase in this time.
The expansion of oil sands development, as well as the increase in roads and seismic lines, can be seen clearly by comparing the 2010 and 2018 human footprint maps, particularly in the area near Conklin and Winefred Lake. Another rapidly increasing land use is crop cultivation, which occupied 1,802,313 km2 in 2010, and increased to 2,580,503 km2 in 2018. This land use change mainly affects the southern portion of Harvesting Area B. Other agricultural land uses, including pasture and fruit cultivation, decreased during this period.
And one of the things too, like open pit mines but also forestry, and they’ve taken a lot of lumber out of the areas that... over my lifetime living here. We never used to have winds that we do have today. Why is that? It's open pit mining and also forestry taking it. They take a big footprint out of Alberta, people want to always blame open pit mining, but forestry takes a big chunk too. They make a bigger footprint than the oil sands I think.
Peter Hansen
Trend in Human Footprint
Trend in human footprint was calculated using a sample-based method (3 x 7 km samples) for the Lower Athabasca Region (93,212 km2), a smaller region contained by Métis Harvesting Area B, between 1950 and 2019.
Although all human footprint categories continued to increase between 2010 and 2018 (see section above), the largest relative jump in human footprint in the region occurred between 1980 and 2000, during which there were significant increases in both agricultural and forestry footprint.
- The total amount of human footprint in the Lower Athabasca Region increased by 7.3 percentage points between 1950 and 2019, from 1.6% to 8.9%.
-
This increase was largely driven by Forestry, Energy, and Agriculture features, which increased by 2.9, 1.7, and 1.6 percentage points, respectively.