
Section 3.2
Spatial Analysis
The effects of disturbance variables on mammal density.
Spatial Variable Summaries
This section explores how human disturbance in the region affects hunted and trapped species. The following species yielded enough data in this project to be used for spatial analysis.
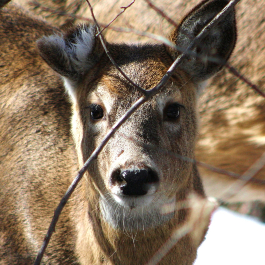
White-tailed Deer (Odocoileus virginianus)
Photo: Kate Tucker
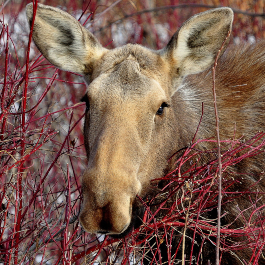
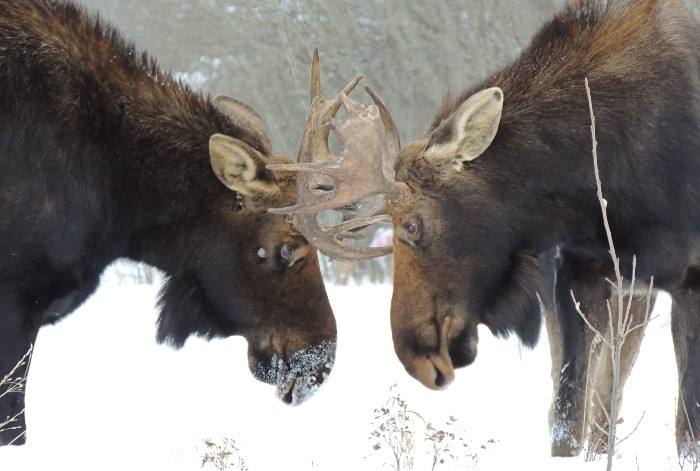
Moose (Alces alces)
Photo: Arnold Janz
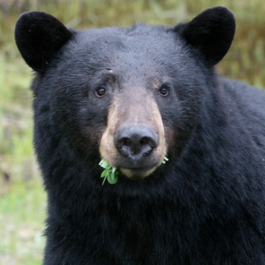
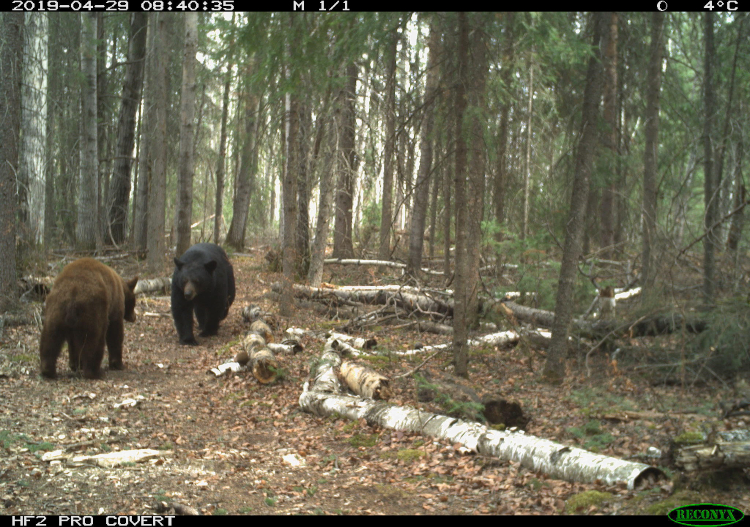
Black Bear (Ursus americanus)
Photo: Jethro Taylor
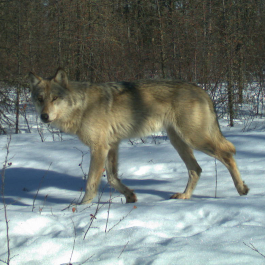
Gray Wolf (Canis lupus)
Photo: Wildtrax
Introduction
Several spatial variables were summarized for each of the camera locations to explore whether human disturbance in the region affects hunted and trapped species:
- Landcover (vegetation) or human footprint, determined using the ABMI’s 2018 land cover layer and the 2018 Human Footprint Inventory.
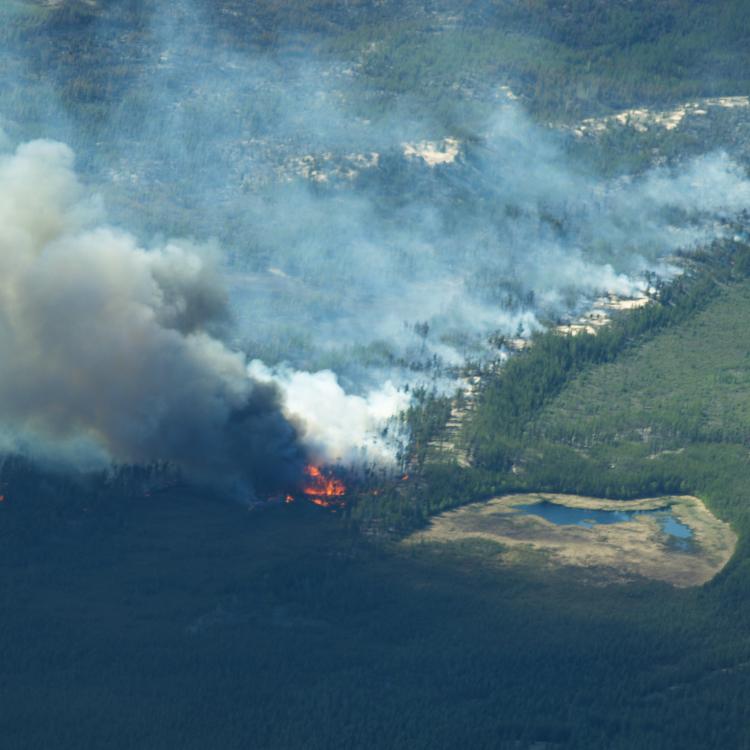
- Recently burned areas. The large fires during the summer of 2016 highly impacted the area around Fort McMurray.
- Human activity, either motorized or by foot.
- Proportion of surrounding human footprint disturbance. Buffers of 1 km, 500 m, 100 m, and 50 m were drawn around each camera, and the proportion of human footprint was summarized in each. At the 1-km scale, disturbance ranged from 0% to 44%. At the 50-m scale, disturbance ranged from 0% to 100%. This wide range of distances was chosen to capture both local and regional effects of human disturbance.
- Proportion of forest harvest activity in a 1-km buffer.
Other variables designed to quantify disturbance were experimented with, including the distance to the nearest industrial facility (energy sector or otherwise); however additional data are necessary.
Spatial Analysis
Data from the following species were used for spatial analysis:
- White-tailed Deer
- Moose
- Black Bear
- Gray Wolf
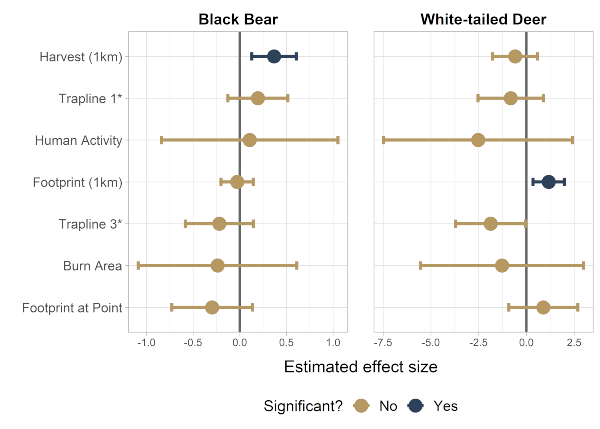
Statistically significant effects were found in two species when using the 1-km buffer scale:
White-tailed Deer abundance increased as the proportion of human footprint increased; White-tailed Deer were more common at deployments that were placed in a more disturbed area. This is a common finding, both in the scientific literature and in standard ABMI camera modeling: this species responds positively to human footprint (Latham et al. 2011, Laurent et al. 2021).
Black Bears were found to be more abundant at locations with an increased proportion of disturbance from forest harvest activity. The effect size was small, but is in line with broader findings from ABMI modeling on black bear habitat association (see ABMI results, here). This effect may reflect increased food availability for bears in recently harvested areas.
-1.jpg)
Significant Results
The two significant results can be interpreted as follows:
- a 10% increase in the proportion of human disturbance within 1 km of a camera site results in a density increase of 1.15 white-tailed deer per km2, and
- a 10% increase in the proportion of harvest area disturbance within 1 km of a camera site increases Black Bear density by 0.34 individuals per km2.
References
Alberta Biodiversity Monitoring Institute. 2017. Alberta Wall-to-Wall Vegetation Layer Including “Backfilled” Vegetation in Human Footprints (Version 6). Alberta Biodiversity Monitoring Institute, Alberta, Canada. Report available at: abmi.ca.
Alberta Biodiversity Monitoring Institute. 2020. Human Footprint Inventory 2018 (Version 1). Alberta Biodiversity Monitoring Institute, Alberta, Canada. Report available at: abmi.ca.
Latham, A.D.M., M.C. Latham, N.A. McCutchen, and S. Boutin. 2011. Invading white-tailed deer change wolf-caribou dynamics in northeastern Alberta. Journal of Wildlife Management, 75(1), pp. 204-212, DOI: 10.1002/jwmg.28
Laurent, M., M. Dickie, M. Becker, R. Serrouya, and S. Boutin. 2021. Evaluating the mechanisms of landscape change on white-tailed deer populations. Journal of Wildlife Management, 85(2), pp. 340-353, DOI: 10.1002/jwmg.21979